
Study population
Inclusion and ethics
A total of n = 1,000 consecutive EVLP cases conducted at Toronto General Hospital from 2008–2024 were reviewed for inclusion in the study cohort. In accordance with the Declaration of Helsinki, University Health Network (UHN) Research Ethics Board (REB) and institutional approval was obtained for the collection, storage and analyses of the biospecimens and data used in this study (UHN REB nos. 12-5488-13 and 11-0170-AE); informed consent was obtained from study participants. After review of each EVLP case file, n = 49 cases were excluded from analyses because of incomplete documentation. A total of n = 951 cases of isolated human lung perfusion were included for DT modeling and analyses in this study. An independent test cohort (that is, not part of the training data), comprising n = 45 cases of human lungs assessed using the ex vivo platform at our center in 2024–2025, was used as the test dataset in this study. During the study period, a total of n = 16 EVLP cases were treated with alteplase and, therefore, left out of DT model training. Sample sizes for each of the data modalities are described in Supplementary Fig. 2. Given that the objective of this study was to create a DT capable of predicting future lung function using ML models trained on existing patterns in historical data from human ex vivo lung function, we applied stringent inclusion criteria and did not perform any imputation. Thus, only EVLP cases with complete clinical records where there were no missing values were used to train the ML models for each parameter (Supplementary Fig. 2b).
EVLP protocol
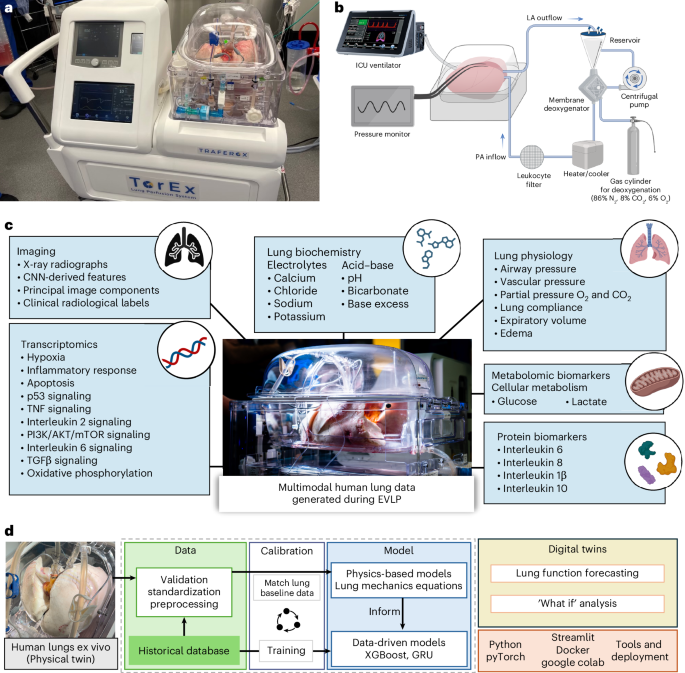
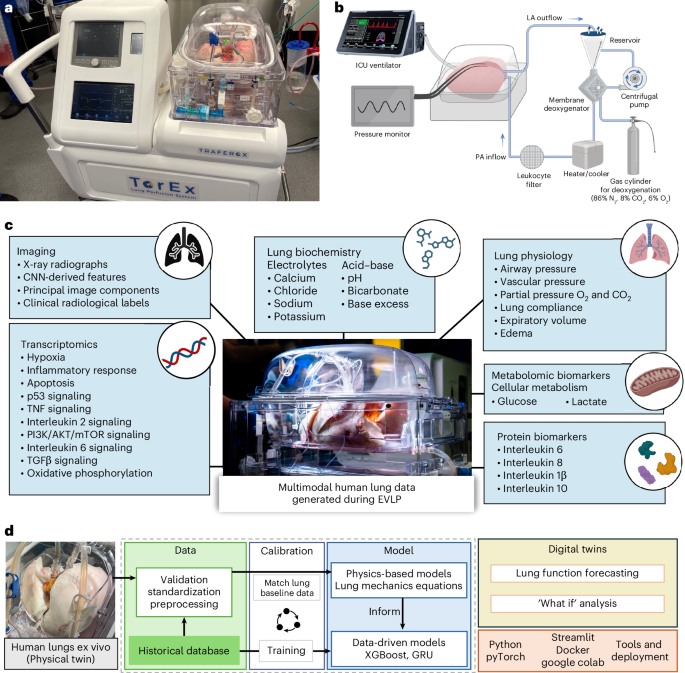
All EVLP procedures were conducted according to the previously reported Toronto EVLP protocol7. Briefly, after lung retrieval, the left atrium and pulmonary artery were cannulated and connected to the EVLP circuit for perfusion with an acellular, low-potassium dextran solution. Target flow of the circuit was set at 40% of predicted cardiac output on the basis of the size of the human lung donors. Circuit flow started as 10% of the target flow and incrementally increased to reach full target flow within the first hour of lung perfusion. Circuit temperature started at 20 °C and gradually increased to reach a physiological temperature of 37 °C within the first 60 minutes of perfusion to avoid injuring the cold-stored lungs. Lung ventilation started after 30 minutes of perfusion. An ICU-grade ventilator (Servo-i (Maquet) or Bellavista (Vyaire Medical)) was connected through an endotracheal tube and set to flow-controlled ventilation. Under baseline breathing setting, ventilation settings were set at a tidal volume of 7 ml kg−1 of predicted body weight, a constant positive end-expiratory pressure (PEEP) of 5 cmH 2 O, a respiratory rate of seven breaths per minute and fraction of inspired oxygen (FiO 2 ) of 21%. During all EVLP cases, an evaluation of lung function was performed hourly. During this assessment period, the ventilation settings were set to a tidal volume of 10 ml kg−1 of predicted body weight, PEEP of 5 cmH 2 O, a respiratory rate of ten breaths per minute and an FiO 2 of 100%. All monitoring equipment associated with the EVLP platform, including mechanical ventilators, blood gas analyzers, flow meters, temperature sensors and pressure transducers, were calibrated in accordance with the medical device standards and the local institutional policies governing clinical equipment maintenance. Calibration was performed before each perfusion run by organ perfusion specialists to ensure that all measured physiological parameters were traceable to certified reference values, thereby providing confidence that the observed values used in DT development were accurate and well calibrated.
Biospecimen and data collection
For all EVLP cases, the lung function data collection methodology was consistent with the Toronto EVLP Protocol7. A complete list of all human lung data obtained during EVLP can be found in Supplementary Table 2. Physiological parameters were recorded hourly and at high frequency (one data point per 10 ms) using an ICU-grade ventilator (Servo-i (Maquet) or Bellavista (Vyaire Medical)). Lung perfusate samples were extracted from the sampling port of the reservoir on the EVLP system. Perfusate samples were used for immediate testing using arterial blood gas analyzers (GEM Premier 5000 (Werfen) and RAPIDPoint 500 (Siemens)) for gas-exchange, metabolomic and biochemical data. Additional perfusate aliquots were frozen and stored at −80 °C for downstream protein biomarker measurement using a multiplexed ELISA (Ella, Protein Simple) for four proteomic biomarkers: IL-6, IL-8, IL-1β and IL-10. PAP and left-atrial pressure (LAP) data were recorded with a continuous pressure monitor (IntelliVue MX450 (Philips)). Pre-EVLP and post-EVLP lung tissue biopsy samples of approximately 1 cm × 3 cm were collected using a mechanical stapler and snap-frozen in liquid nitrogen for microarray analysis (Clariom D Assay (Thermo Fisher Scientific))56,57. EVLP is a closed circuit where the volume of perfusate within the system is carefully monitored during clinical EVLP. Hourly lung edema was estimated by measuring the volume of perfusate loss, which is the volume of perfusate that does not return to the EVLP circuit reservoir and remains in the lungs12. Radiographic (X-ray) images were taken at the first and third hours of perfusion using standard portable radiography (DRX-Revolution, Carestream Health) by medical radiology technicians13. The clinical history of each lung was recorded at the time of organ donation and accessed using the Toronto Lung Transplant Program (TLTP) database.
Data preprocessing
An automated data preprocessing pipeline was constructed using Python to preprocess each of the five main data modalities for a given EVLP case: (1) high-resolution (one data point per 10 ms) time-series ventilator data; (2) hourly lung function parameters; (3) lung X-ray images; (4) transcriptomics; and (5) protein biomarker data.
For high-resolution ventilatory flow and pressure data, breath segmentation was first performed to divide the ventilator waveform into individual breaths, with inspiratory and expiratory phases delineated by changes in flow direction and corresponding pressure inflection points. From the segmented ventilator waveforms, four mechanical parameters (dynamic compliance, peak airway pressure, mean airway pressure and expiratory volume) were derived using physics-based computations. Peak and mean airway pressures were computed as the maximum and time-averaged pressures over the respiratory cycle. Expiratory volume was integrated from expiratory flow and dynamic compliance was computed as the ratio of tidal volume to the pressure difference between peak pressure and PEEP. For this study, approximately 200,000 individual breaths were labeled using a semisupervised approach guided by clinical specialists. One of six clinically relevant labels was assigned to each breath: ‘regular breathing’, ‘assessment’, ‘bronchoscopy’, ‘recruitment’, ‘inspiratory pause’ and ‘noise’ (Supplementary Fig. 3). Regular breathing and assessment breath labels were used in forecasting analysis tasks, while the remaining labels were included in a detailed data review to derive clinical feature annotations: clinical intervention status of bronchoscopy, lung recruitment, respiratory pauses as yes/no indicator variables to denote whether certain clinical intervention happened between each pair of two consecutive hourly assessments and the number of inspiratory pauses that happened during each of the hourly assessments as count values. These clinical intervention features (status of bronchoscopy, lung recruitment and respiratory pauses) were used as yes/no indicator variables to enable subsequent multimodal time-series forecasting tasks using the GRU model.
Hourly lung function features were retrieved for all historical cases from the TLTP database. X-ray image features were extracted using latent features from the last convolutional layer of a CNN-based approach (ResNet-50) according to previous reports13. PC analysis was used to extract the top ten PCs from the image feature vectors from the last convolutional layer before the fully connected layer (Supplementary Fig. 4). Microarray data from lung tissue biopsies were analyzed using gene set enrichment analysis (GSEA; version 4.3.3). Single-sample GSEA (ssGSEA), an extension of GSEA, was used to calculate separate enrichment scores for the Hallmark gene sets35 for each of the paired human lung samples. Protein concentrations were measured using the Ella multiplex ELISA platform and exported from the analysis software (Simple Plex Runner, version 4.0.0.28).
DTs of human lung model development
DT code files are available on GitHub (https://github.com/Sage-Lab-ai/DT_Lung) and a fully deployed web-based application of the ex vivo human lung DTs is available online (https://dt-lung.streamlit.app/). For every assessment metric generated by an ex vivo human lung, a specific multimodal time-series forecasting model was developed, optimized and validated for that parameter. All code pipelines were developed using the following libraries: Pandas version 2.2.2, NumPy version 1.26.3, PyTorch version 2.3.1, XGBoost version 2.10, Scikit-learn version 1.5.1, SHAP version 0.46.0 and SciPy version 1.13.0 in Python version 3.12. Each model included the optimal multimodal set of other lung features to accurately predict the target feature. Additional details on model training, tuning and parameter permutations can be found in the Supplementary Note 1.
DT model calibration
The DT model underwent rigorous training and calibration processes for both GRU and XGBoost architectures. Notably, these two models use fundamentally different optimization strategies to minimize loss during training. The XGBoost model constructs an ensemble of decision trees through gradient boosting, a stage-wise, additive procedure. The XGBoost algorithm starts by initializing the model with a constant value, such as the mean of the target values. The algorithm calculates the prediction error between the true values and predictions (that is, MAE in the context of this study). Next, a decision tree is trained to predict these residuals and the overall prediction is updated by adding the new tree’s predictions. This process of adding more trees to the ensemble is repeated, where each subsequent tree aims to reduce the errors from previous trees and incrementally improve performance. To ensure optimal calibration of the DT, we conducted an exhaustive hyperparameter grid search for every XGBoost model (total n = 216 models) developed in this study. The hyperparameters tuned in this process each have a distinct role in shaping model performance and were documented in Supplementary Table 8.
Similar to other recurrent neural network architectures, the GRU processes sequential data iteratively, updating its hidden state at each time step on the basis of the current input and the preceding hidden state. At each step, it computes a candidate activation that integrates information from both sources. This candidate activation is used to update the hidden state for the subsequent time step. The update is governed by two gating mechanisms: the reset gate, which controls the extent to which the previous hidden state is forgotten, and the update gate, which regulates how much of the candidate activation is incorporated into the new hidden state. By selectively remembering or forgetting past information from per-breath time-series data, the GRU models can capture long-term dependencies in sequential lung physiology data.
To model complex dynamics of lung physiology parameters, large and complex models are developed through rigorous calibration in this study. Supplementary Table 9 provided a summary of the number of trainable parameters for each GRU model setup. Model training involved gradient-based optimization using backpropagation through time to minimize the loss function (that is, MAE or mean squared error) comparing the model predictions to the ground-truth lung physiology measurements. The models were trained through 50 epochs with a batch size of 32. In this process, the GRU was ‘unrolled’ across all time steps and gradients of the loss function with respect to each model parameter (that is, weights and biases) were computed. These gradients were then used to update the parameters using the Adam optimizer. Because of the nonconvex nature of the loss function, the optimization sought local minima that yielded the best alignment between predicted outputs and the ground truth. To ensure fast and stable convergence toward these minima, we tuned hyperparameters using a random search method with 50 hyperparameter combinations for each model configuration (total n = 96 models), with hyperparameters such as the learning rate and the learning rate scheduler. We used 20-fold cross-validation and averaged over five random seeds to give a more stable performance signal to guide search. A full list of hyperparameters tuned for GRU models can be found in Supplementary Table 10. In the DT framework, this iterative parameter calibration allows the GRU to learn temporal dynamics of ex vivo lung function data. As the training progresses, the network parameters are adjusted such that the GRU-based DT captures both short-term variations and long-range dependencies in lung physiology, thereby achieving a calibrated and biologically meaningful predictive model.
Model performance was reported using 20-fold cross-validation to provide a robust, unbiased estimate of the model’s generalization performance. To control for stochastic variation and assess model stability, each configuration was trained using ten different random seeds. In total, 960 rounds of training were performed across the 96 model setups.
Residual testing on digital lung models
To assess potential systematic bias in model forecasts, residual diagnostic analyses were performed for each hourly lung functional parameter. Residuals were computed as the difference between model-predicted values and corresponding observed measurements, using out-of-fold predictions from cross-validation on the full set of historical EVLP cases. This approach ensured that each residual reflected model performance on data not used during the corresponding training fold. One-sample t-tests were conducted to evaluate whether the mean residual significantly differed from zero, which would indicate a consistent overestimation or underestimation across cases. The t statistics and P values are reported in Supplementary Table 4.
DT performance and clinical benchmarking
To contextualize the model’s predictive error within clinically relevant variability, we compared the magnitude of DT error against the natural interlung variation observed in a randomly sampled cohort, which is representative of typical clinical EVLP studies. For each hourly lung functional parameter, a resampling-based analysis was performed; random samples of n = 5 historical EVLP cases with 20 repeats were performed to simulate the variability encountered in small-scale clinical research. For each subset, the %CV was computed as a measure of interlung spread. The mean %CV across the 20 resampling iterations was then calculated for each parameter. These values were compared to the digital lung model’s MAPE, enabling an evaluation of DT predictive accuracy relative to cohort variability. This comparison was conducted across all key physiological, biochemical and metabolite parameters commonly reported in ex vivo lung clinical studies (Extended Data Table 5).
DT validation
Simulated lung profiles
The simulated n = 50 lung profiles were generated using a KNN36 on the basis of historical cases in the TLTP database matched for age, sex, height, weight, brain or cardiac death and total lung capacity (size). The lung profile was first generated by randomly sampling for age, sex, height, weight, brain or cardiac death and size. Then, these anchoring features were used as input features of the KNN model to find n = 3 closest neighbors (cases) in the historical database for each data modality. Next, for each parameter to be synthesized in hourly tabular data, image features and omics, the average value of the three neighboring cases was taken as the synthetic value for each corresponding parameter at each time point. For time-series per-breath parameter values, the same procedures were repeated except for the average parameter values of every breath that were calculated on the basis of n = 2 neighboring cases to preserve as much interbreath parameter variability as possible.
Test dataset evaluation
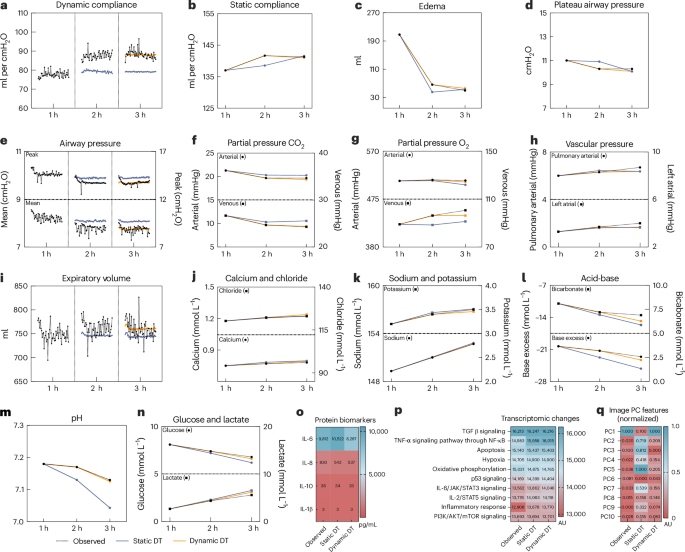
A cohort n = 45 clinical EVLP cases were performed to serve as a separate test set to validate the digital lung model performance. Multimodal lung functional parameter data were curated, cleaned and preprocessed following the standardized procedures described above, ensuring consistency in feature engineering and data quality across datasets. For each case, static and dynamic DT inference was performed to derive forecasted lung functional parameter values. These predictions were quantitatively evaluated against ground-truth measurements obtained from the EVLP system, with MAE and MAPE calculated for each parameter as the main performance metrics.
Personalized therapeutic efficacy and safety modeling with DTs
During clinical EVLP, a 20-mg dose of alteplase (tissue-type plasminogen activator) was administered to human lungs with clinical suspicion of PE (Fig. 3a,b). Alteplase was administered through the perfusate reservoir (pulmonary vasculature) after the first hour (baseline) assessment of the ex vivo lung. The first-hour baseline data were used to forecast lung functional parameters at the second and third hours of perfusion. Given that alteplase was administered shortly after the first hour (that is, after baseline data collection), the ‘first-hour effect’ refers to the forecasted second-hour values (alteplase effect at the second hour), whereas the ‘second-hour effect’ refers to the forecasted third-hour values (alteplase effect at the third hour) for the digital lung approach. A total of 16 EVLP cases received alteplase treatment in the study cohort. Two cases were excluded from the analysis because of incomplete data arising from less than two hours of perfusion on EVLP. The alteplase-treated lungs were used as a real-world DT utility validation cohort in this study. The mechanism of action of alteplase is thrombolysis that leads to reduced pulmonary vascular resistance (PVR), a measurement derived using the following formula:
$$\begin{array}{l}\mathrm{PVR}=\\\displaystyle\frac{\left(\mathrm{pulmonary}\,\mathrm{arterial}\,\mathrm{pressure}\,\left(\mathrm{mmHg}\right)-\mathrm{left}\,\mathrm{atrial}\,\mathrm{pressure}\,\left(\mathrm{mmHg}\right)\right)}{\mathrm{cardiac}\,\mathrm{output}\,({\rm{L}})}\times 80\end{array}$$
In the study cohort, the LAP was constantly maintained at 4 mmHg; therefore, PAP was the key modulator of PVR and identified as the primary endpoint to evaluate the therapeutic efficacy of alteplase. To further evaluate the therapeutic safety profile, hourly lung edema (ml) was measured and compared in alteplase-treated lungs. The conventional control cohort was generated by randomly sampling the historical population of untreated lungs on EVLP. A P value of 0.05 was considered significant for this comparison.
Reporting summary
Further information on research design is available in the Nature Portfolio Reporting Summary linked to this article.
— Source: Nature Biotechnology (https://www.nature.com/articles/s41587-026-03121-4)